I see a lot of people reference the old draft pick value chart which I know some, if not all, of the teams no longer use. Here's an interesting article and a much more useful chart. It's from 2011, so all Josh McCown references are from before his late career Hall of Fame resurgence. The author, not surprisingly, currently works for the Browns. https://harvardsportsanalysis.wordpress.com/2011/11/30/how-to-value-nfl-draft-picks/ Through 12 weeks of the season, most franchises in the National Football League know whether they are in the playoff hunt or if they need to start prepping for the draft: The Green Bay Packers and San Francisco 49ers have almost clinched playoff berths while the Indianapolis Colts have just about locked up the number one overall draft pick. As the Superbowl hopefuls get excited for playoff runs, most of the league has to sit and wait for April. For five months, most teams have to sit and wait. They are on the outside looking in, watching the playoffs on TV. Eventually, only one team will win while the rest of the league can do nothing but watch. That team will be the undisputed winners, and everyone else will have officially lost.Until draft day. On draft day, every franchise wins. No matter what grades draft analysts give out, the draft gives every franchise hope.Every team, every fan, has this hope that their franchise will land the next great player. Everyone has the same dream, that their fourth round draft pick will turn into a Hall-of-Famer. Yet they have little idea what that fourth round draft pick is actually worth. For years, teams used something like the chart Jimmy Johnson developed as the coach of the Dallas Cowboys in the 1980s to value picks against each other. These values are completely arbitrary: there is no statistical evidence to back up the relative values of these draft picks. There is no reason why the 156th pick is 100 times less valuable than the first overall pick. “The Chart” simply dictates how much each pick is worth. These values also have no grounding in the real worth of the players drafted at a given pick. This system is a ridiculous way to value picks because there is no reason behind the values it gives. There must be a better approach.Taking data from www.pro-football-reference.com, I have created a much better system that more accurately values each pick in the NFL draft, similar to the work done by Chase Stuart. Pro-Football-Reference uses a metric called Career Approximate Value (CAV) that allows one to compare players across seasons and positions. It is not meant as the ultimate NFL statistic. It is useful for comparing large groups of players across time and positions, which is exactly the objective here. Using data from 1980 through 2005, I analyzed each overall draft pick from 1 to 224 (the 32nd pick of the 7th round in today’s draft). I found the mean, median, and standard deviation of the CAV for each pick from those 25 years, creating one set of data that represented the historical value of each pick. I then found the mean, median and standard deviation for this new dataset to determine the expected value of a normal draft pick. I then used that normal pick to standardize my data, finding the percentage value over average, or Career Approximate Value Over Average (CAVOA), for every pick in the draft.For example, the first overall pick, historically, has had a mean CAV of 66.7. The standard draft pick had a mean CAV of 15.03. . Thus the first overall pick was 443.39% more valuable than the standard pick. Using this method, I found the CAVOA of every pick in the draft, and then regressed it against overall pick number. The regression equation was with an R2 of 0.91599. The R2 means that the variance in overall pick number explains 91.599% of the variance in CAVOA. Using this equation, I found the expected CAVOA for every pick in the draft.The CAVOA is the comparative value of each pick versus the normal pick and is based off of real, historical, on-field performance. This non-arbitrary statistic is a massive improvement over the old draft chart. To compare my system with the old one, I transformed the old system into a percentage over average as well. The results are below.
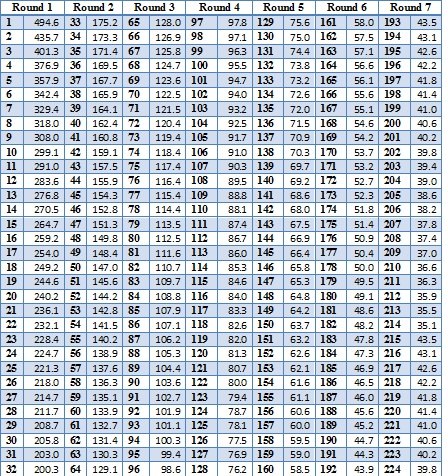
 The old system massively over values the earliest picks and significantly undervalues mid-to-late round picks. The regression line is clearly a better predictor of future value than the old chart.But what do these numbers actually mean in practice? The 94th pick is as close to the normal pick, having a draft value of 100.3 and a CAV of 15. If Josh McCown had retired instead of signing as Caleb Hanie’s backup with the Chicago Bears last week, he would have ended his career with a CAV of 15. So if a team uses the 94th overall pick, it should expect to draft a player with a comparable value to Josh McCown: a marginal backup who may spend some time in the United Football League, but will also have some productive outings in the NFL.In contrast, the first overall pick has a value of 494.6, almost five times greater than the 94th pick; so one should expect a player with a CAV of 74. Brad Johnson, Rodney Harrison,and Corey Dillon all had CAV’s of 74. Given the first overall pick, that is the kind caliber player one should expect to draft: Pro-Bowlers who can help lead their team to a Super Bowl victory. One cannot expect to get a player like Peyton Manning, although it is a possibility; instead, one should anticipate a player of Harrison, Dillon, and Johnson’s caliber.The distribution around each pick is also interesting. The standard deviation of the expected CAV decreases as the pick number increases, suggesting that picks become less and less variable as the draft continues. While this conclusion is accurate, the coefficient of variation is a better measure of variance than standard deviation in this case. Because there is a separate data set for every pick, one has to compare the standard deviation compared the average of each data set. While the standard deviation decreases as the draft continues, the coefficient of variation is constantly increasing, suggesting that picks become much more variable relative to their mean as the draft continues. This finding suggests that one can be more certain of an earlier draft pick’s value than of a later draft pick.
 That said, it is impossible to predict with any accuracy what a given pick’s CAV will be, as the standard deviations are very large. Below is a graph of the 95% confidence interval for every draft pick. The real confidence interval would include negative values for a number of picks, but since this is impossible, I list them as 0. Each pick’s confidence interval includes 0, meaning that no matter where in the draft one picks, there is always the risk of the player picked being a complete bust. However, the upside of picking a superstar diminishes rapidly as the draft unfolds, making earlier picks extremely valuable. This subject, however, is for another study.
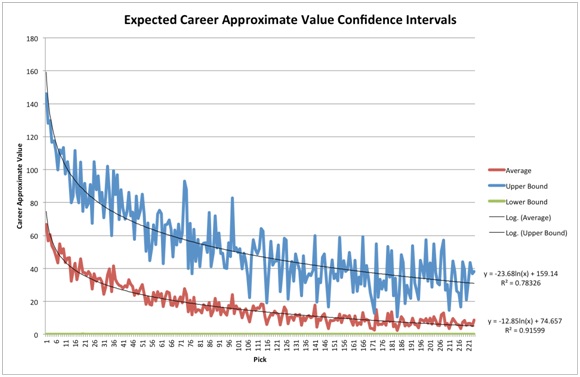 This study is the tip of the iceberg of analysis that is now possible to do. There is a ton of work to be done now that we have an accurate representation the value of every draft pick in terms of both on-field value (expected Career Approximate Value) and in terms of other draft picks (Career Approximate Value Over Average). One can use these data to evaluate any trade involving draft picks, come up with a draft strategy that maximizes total expected Career Approximate Value, and much more.
ForumVisual Realm2023-04-26T12:12:17-04:00

Notifications
Clear all
Topic starter
Posted : Apr. 21, 2016 11:02 am
